Monitoring Dashboard
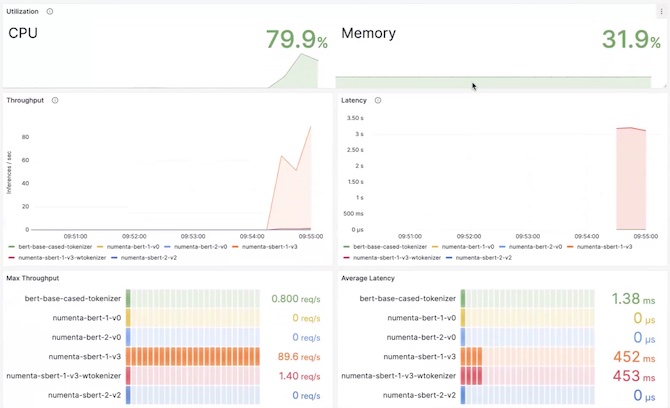
NuPIC includes a monitoring dashboard for you to track the performance and metrics produced by the NuPIC Inference Server. It is useful for monitoring and verifying CPU resource utilization, and for a real-time visual reference of throughput and latency.
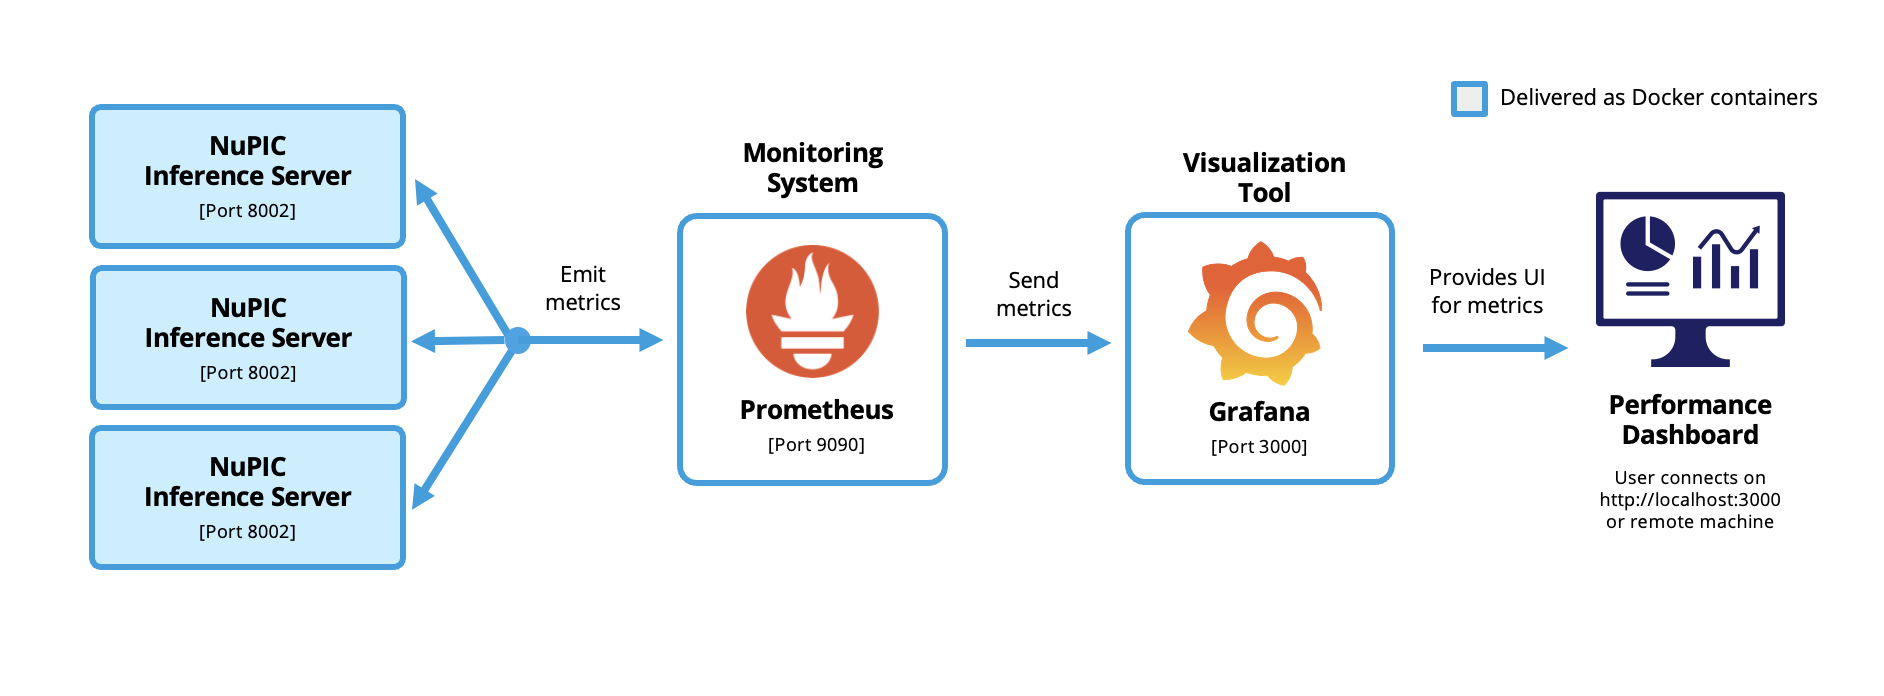
The dashboard is powered by Prometheus monitoring and Grafana visualization tools, which are launched automatically when you install the NuPIC Inference Server. Learn more about how they interact with NuPIC below.
Quick Start
Before you start, make sure that your network security policy allows inbound and outbound traffic from Grafana over port 3000. Additionally, if you are accessing the Inference Server remotely, similarly ensure that your client machine's IP is allowed to access the Inference Server.
Prometheus and Grafana are launched automatically when you start the Inference Server. You can verify using docker ps
Expected output:
CONTAINER ID   IMAGE                                   COMMAND                  CREATED       STATUS                           PORTS                                       NAMES
1f4f80cadf26   nvcr.io/nvidia/tritonserver:23.06-py3   "/opt/nvidia/nvidia_…"   2 hours ago   Restarting (126) 3 seconds ago                                               nupic_inference_server
94c59142bb24   prom/prometheus                         "/bin/prometheus --c…"   2 hours ago   Up 2 hours                       0.0.0.0:9090->9090/tcp, :::9090->9090/tcp   prometheus
1982379aa387   grafana/grafana                         "/run.sh"                2 hours ago   Up 2 hours                       0.0.0.0:3000->3000/tcp, :::3000->3000/tcp   grafana
Grafana can be accessed from the following URL in your web browser. If you are accessing remotely, replace localhost with the IP address of the inference server.
http://localhost:3000The visualization showed at the top of this page can be accessed by clicking on Dashboards in the sidebar of the web interface.
You can also view a more minimalist version using kiosk mode:
http://localhost:3000/d/nupic_inference_server/?theme=light&kioskIn More Detail
Just like the NuPIC Inference Server, Prometheus and Grafana are also deployed as Docker containers. Interactions between the three are orchestrated using Docker Compose, which is a framework that manages communications between multiple containers.
The key components of this setup are as follows:
nupic.examples/examples/dashboard/
├── compose.yml                                 # Main docker compose file
├── grafana                                     # Grafana visualization server
│   ├── dashboards                              # Preconfigured dashboards
│   │   ├── dashboard.yml                       # Dashboard configuration
│   │   └── nupic_inference_server.json         # Sample dashboard
│   └── datasources                             # Grafana metrics datasources
│       └── prometheus.yml                      # Prometheus datasource configuration
└── prometheus                                  # Prometheus metrics server
    └── prometheus.yml                          # Prometheus configuration
Overall orchestration is configured in the compose.yml file, while configurations for the constituent components are located within their respective directories.
Prometheus is configured to collect metrics from (one or more) Inference Server(s) via port 8002. Grafana, on the other hand, uses port 9090 to connect to Prometheus. This provides a nice web UI to view the metrics. Finally, the user connects to Grafana over port 3000, which allows the UI to be viewed on http://localhost:3000 (or from a remote machine).
Updated 7 days ago